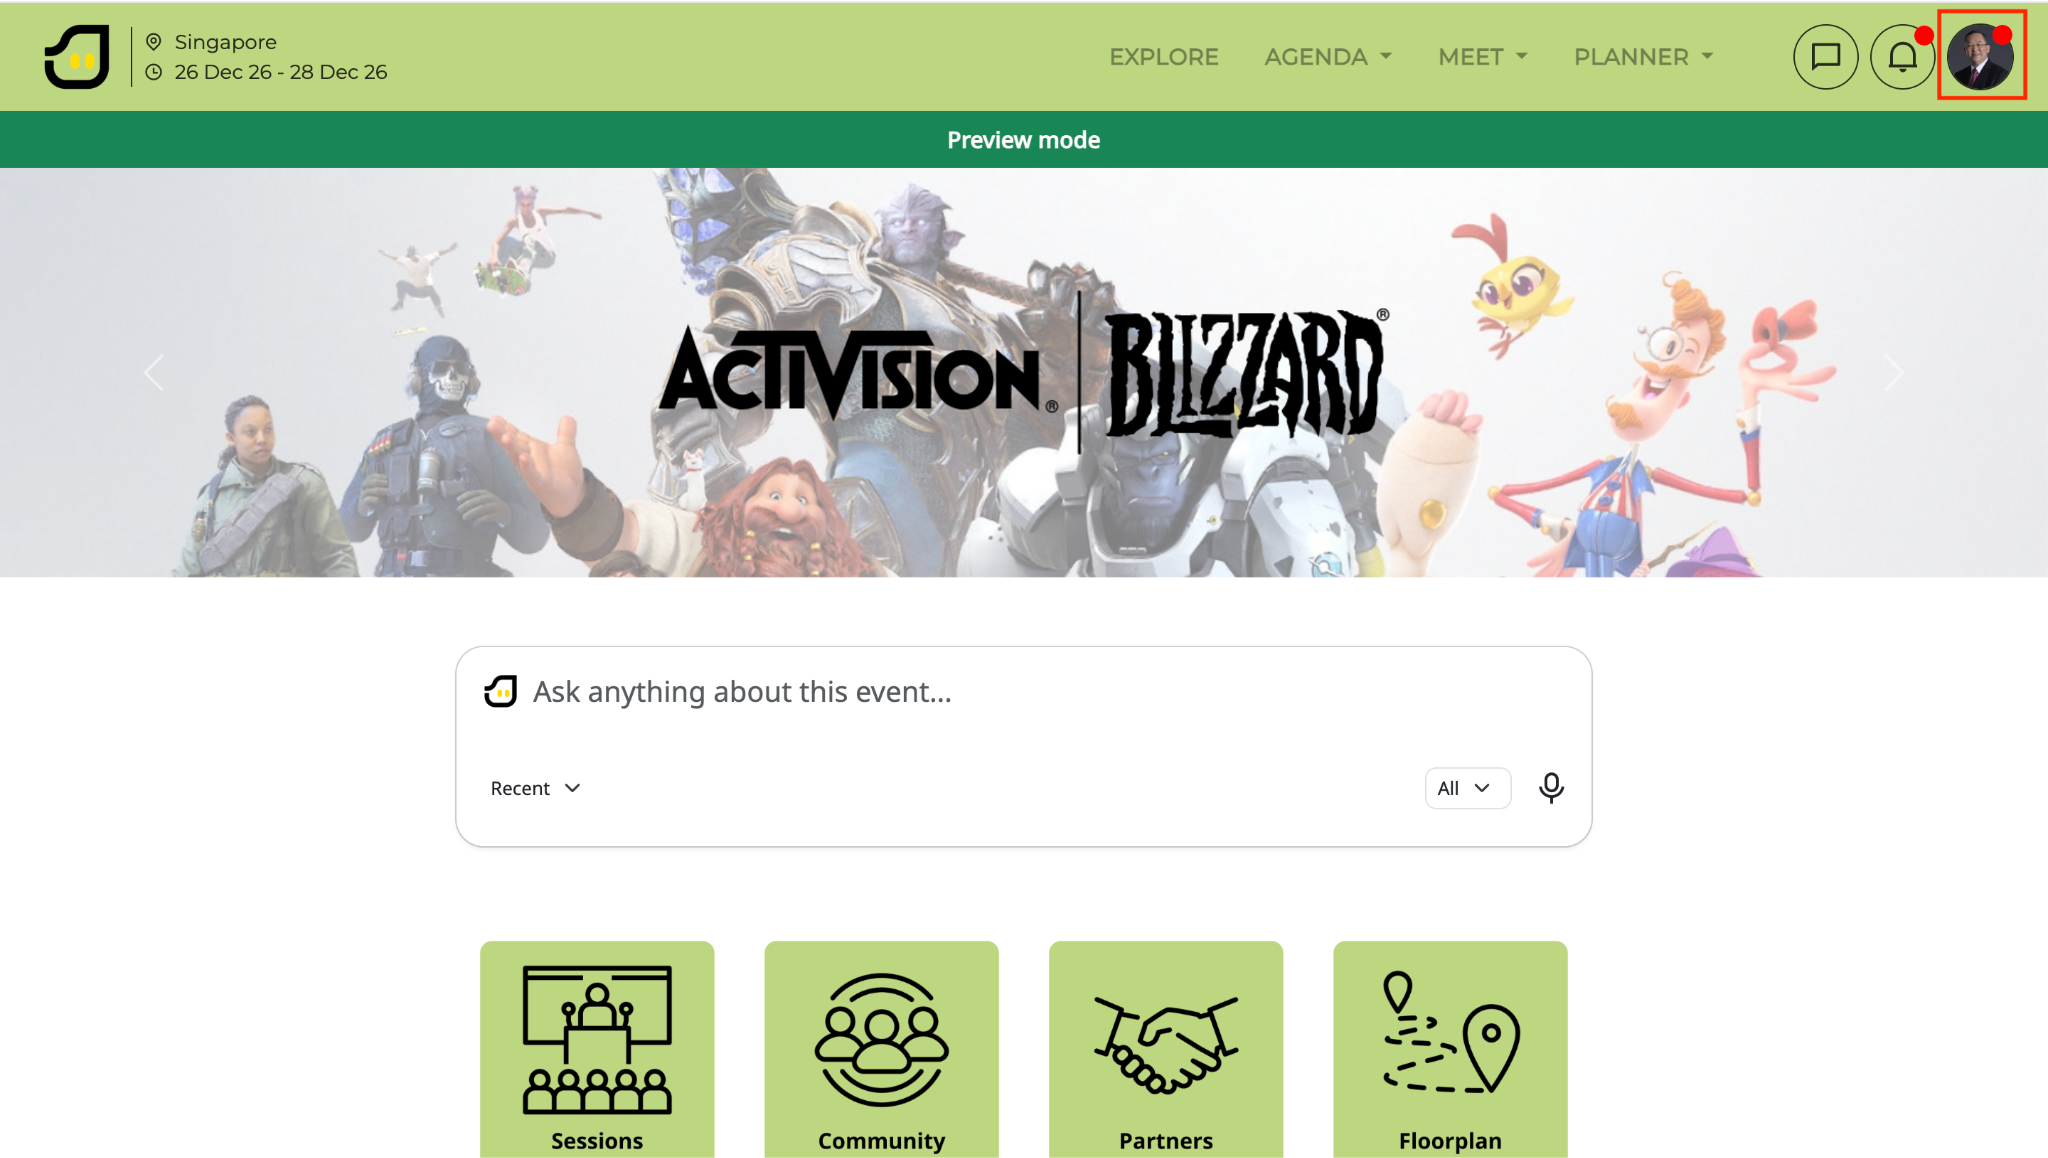
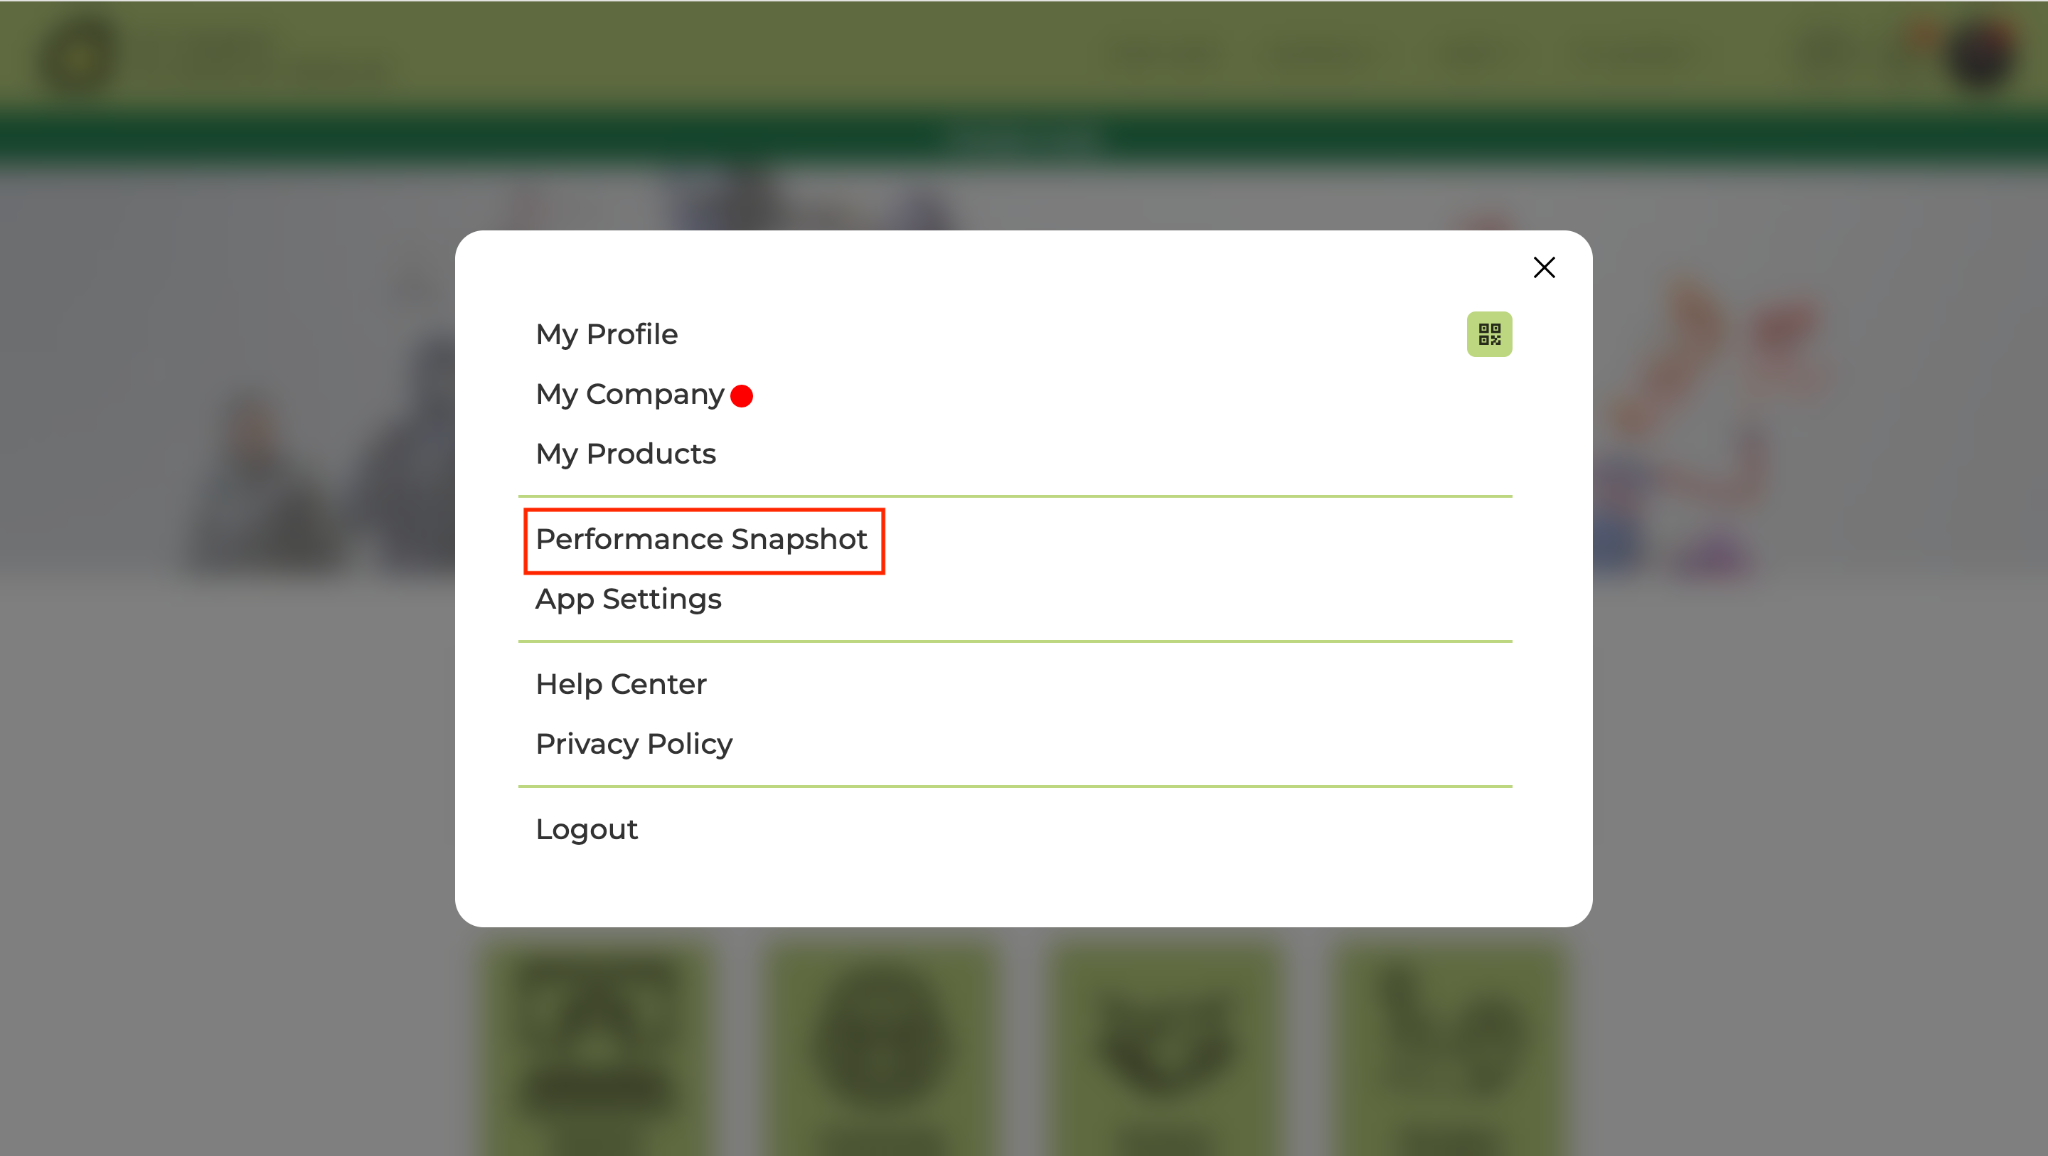
To view the Performance Snapshot on your profile, simply click on your profile at the top right corner of the page and click on the Performance Snapshot.
Read this guide in
| 中文 | ภาษาไทย | 한국어 | tiếng Việt | 繁體中文 | Bahasa Indonesia | 日本語 | Español | Portuguese |
Click on your Profile at the top right corner of the navigation bar and select Performance Snapshot from the dropdown menu to open your analytics dashboard.
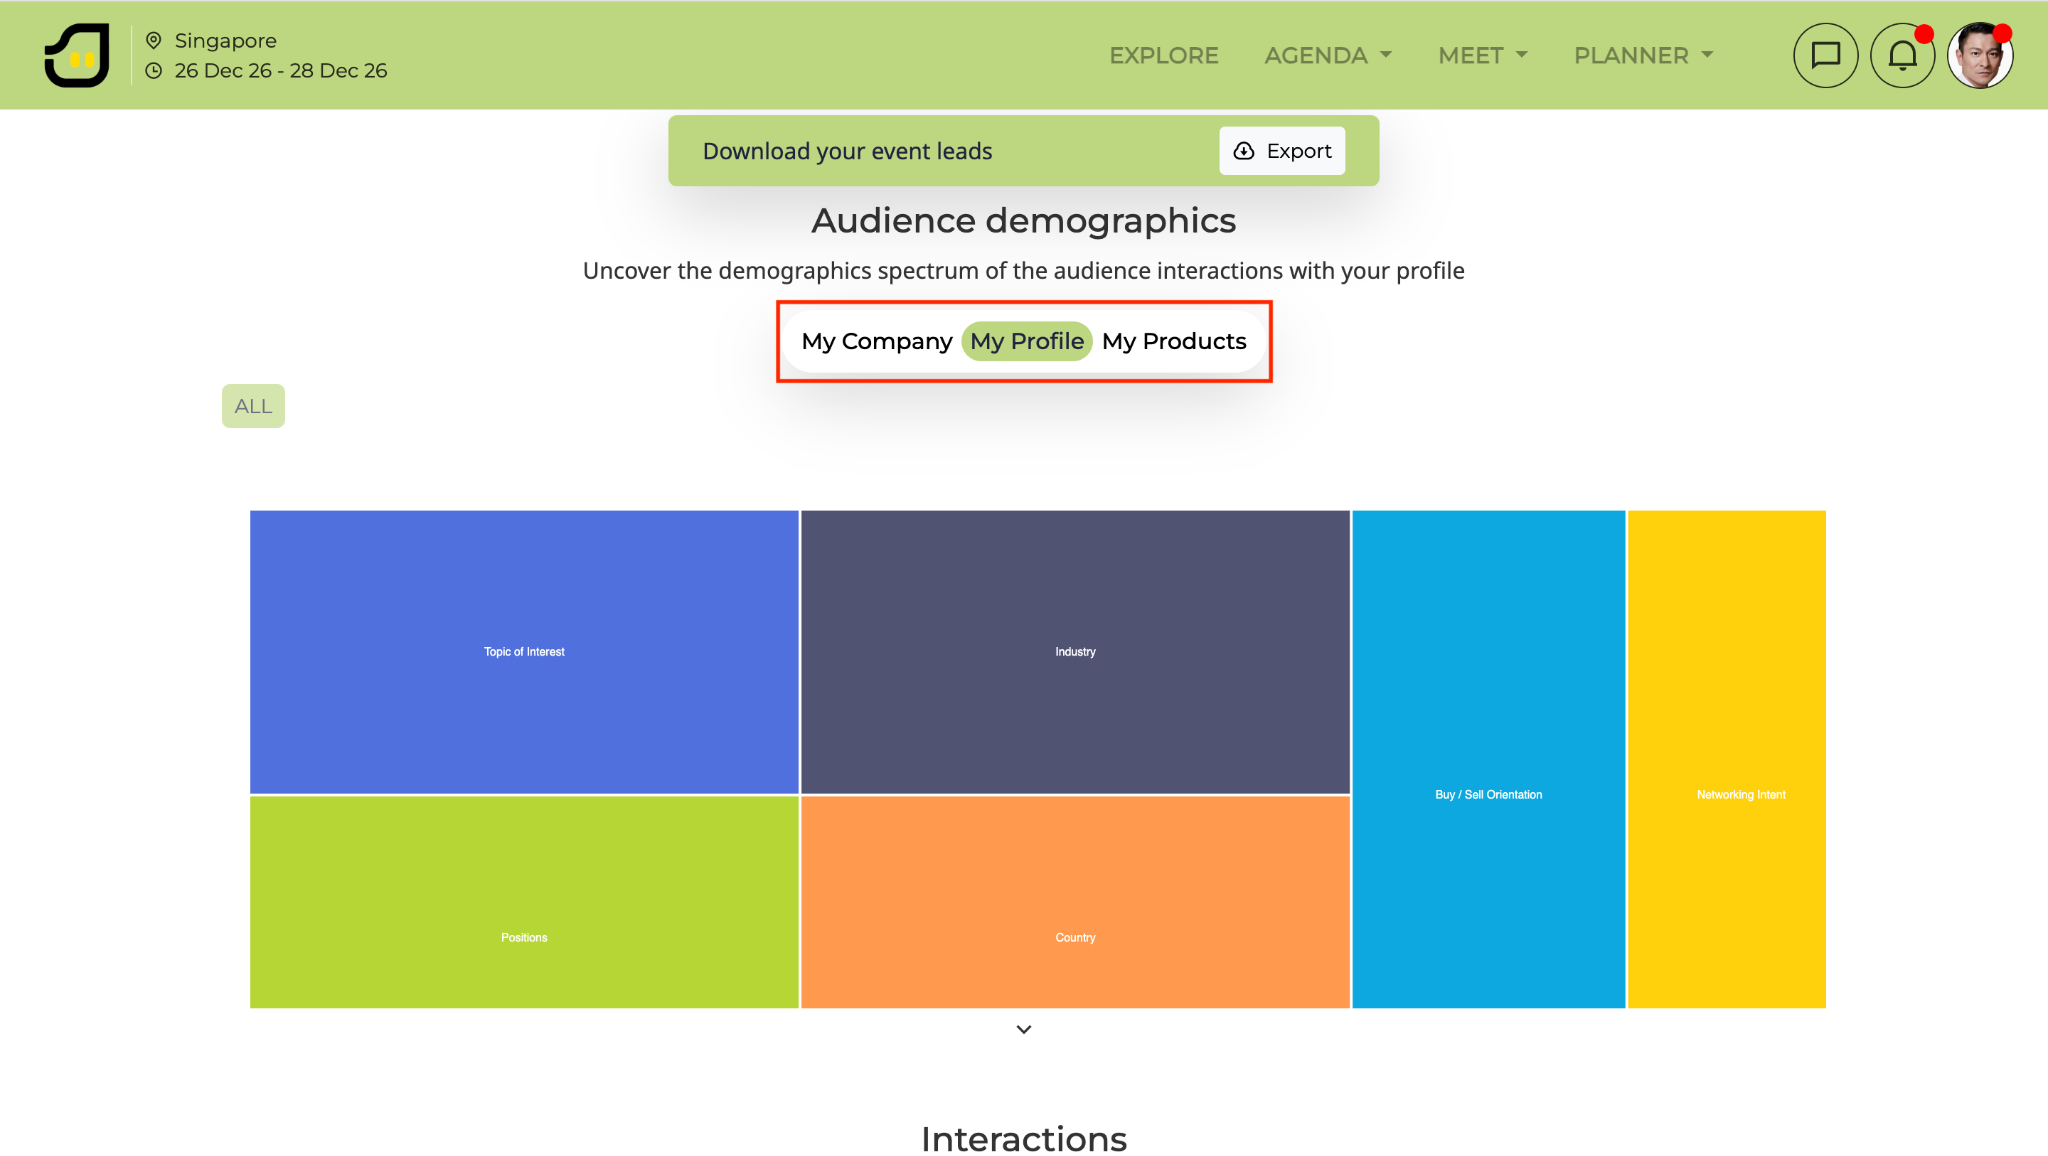
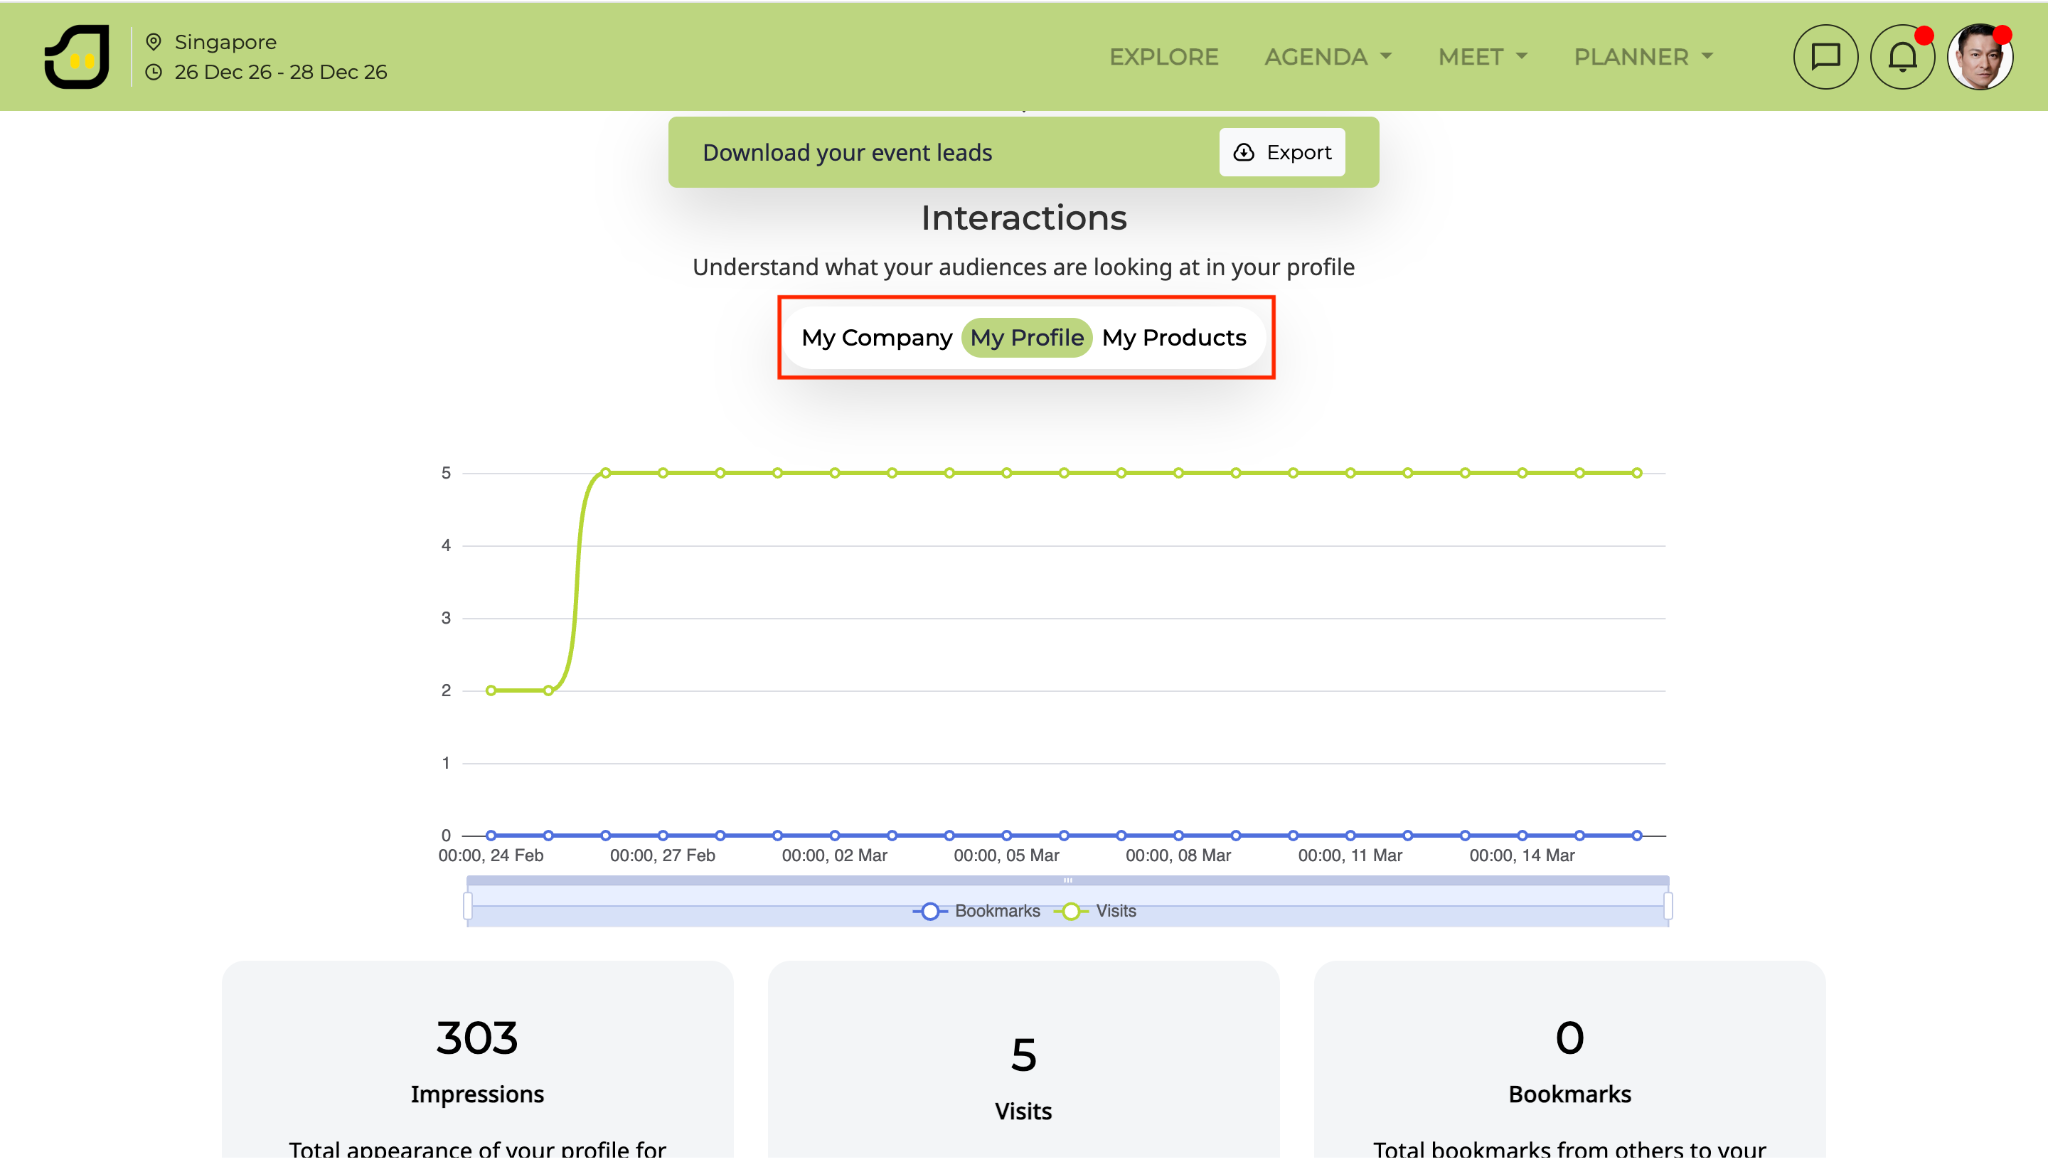
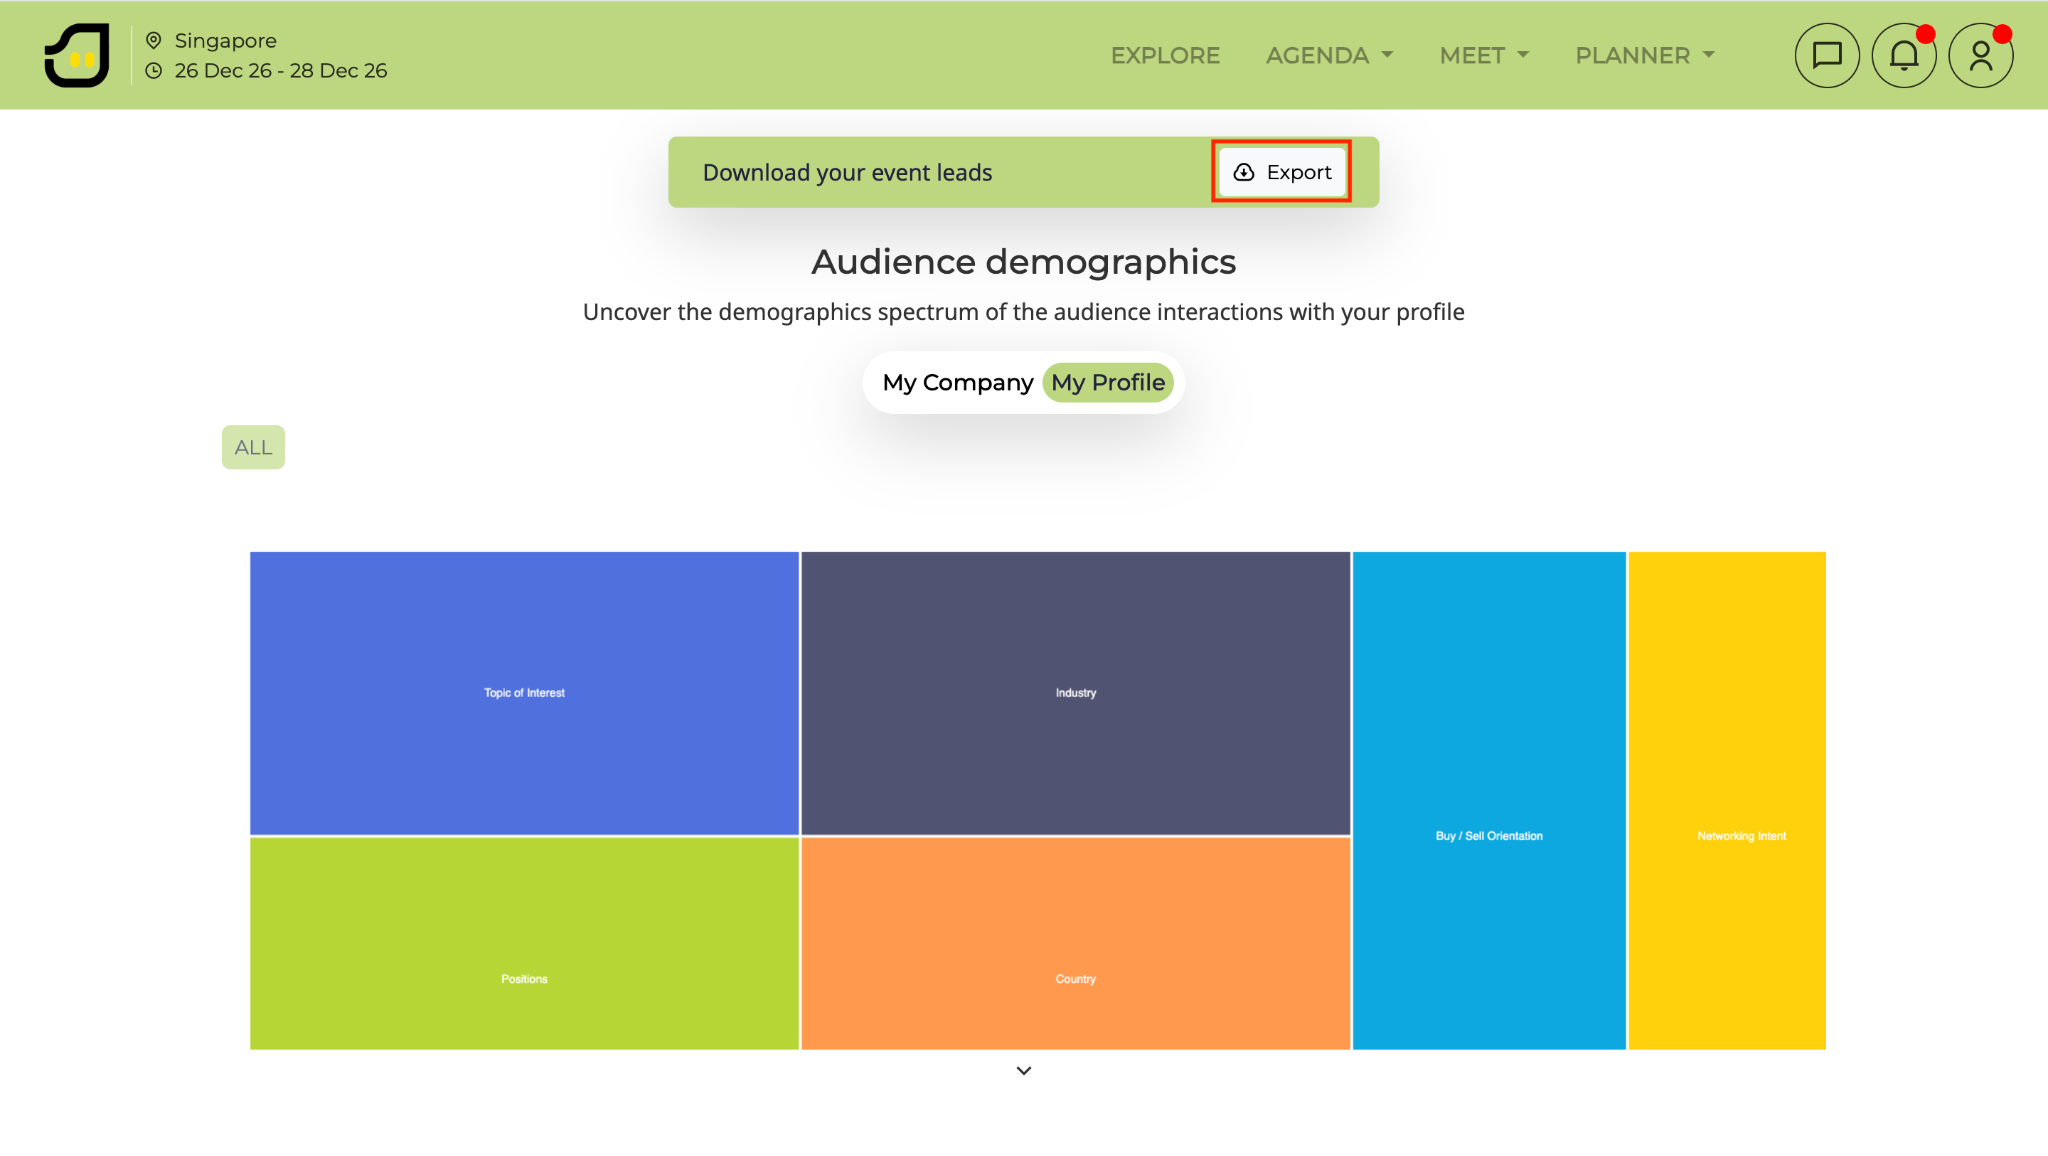
Review the attribute trends of attendees interacting with your profile; click on the Color boxes to see specific breakdowns for My Company, My Profile, or My Products.
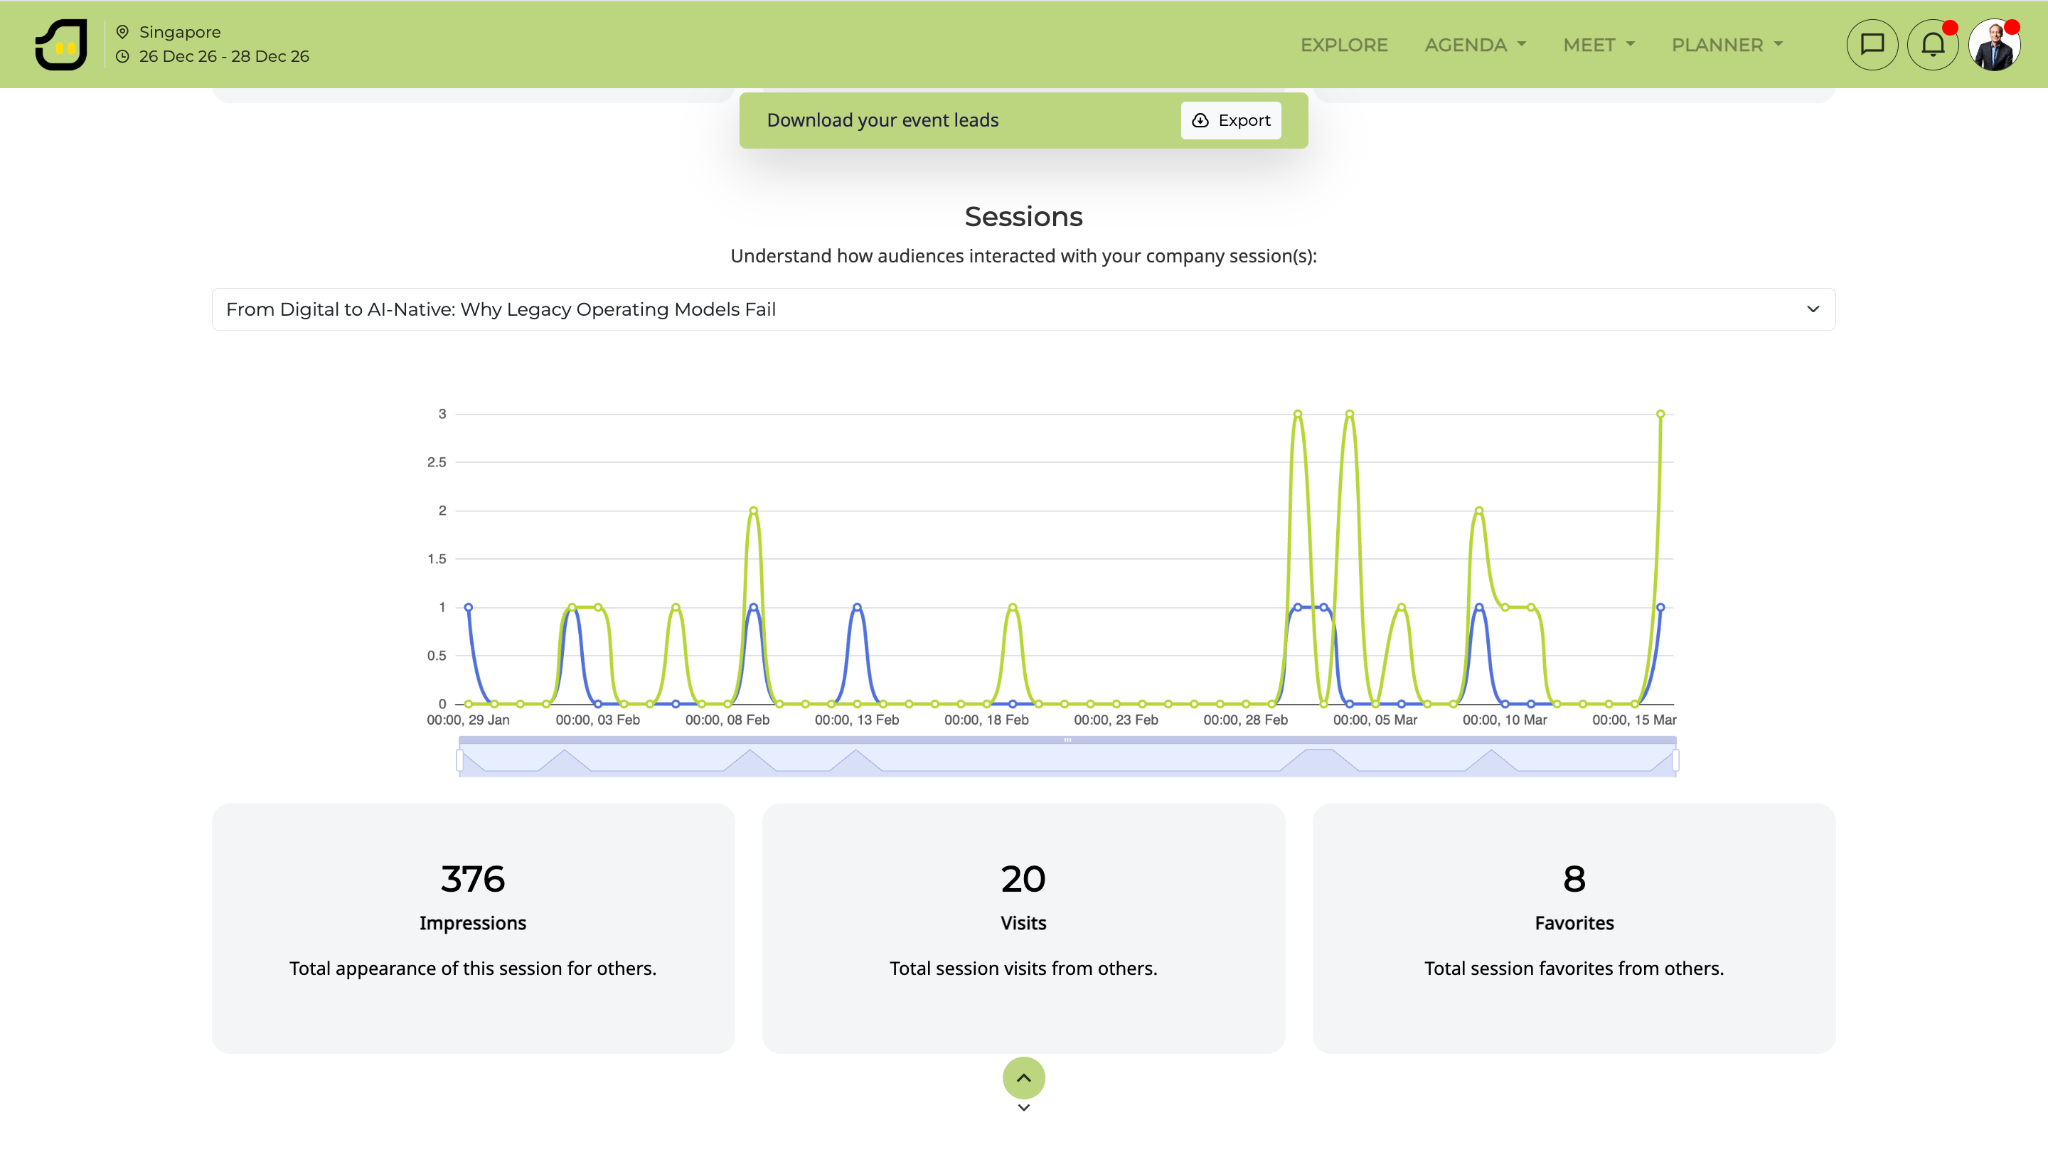
View the Interactions graph to monitor Impressions, Visits, and Bookmarks, or check the Sessions graph for data on your company's presentation engagement.
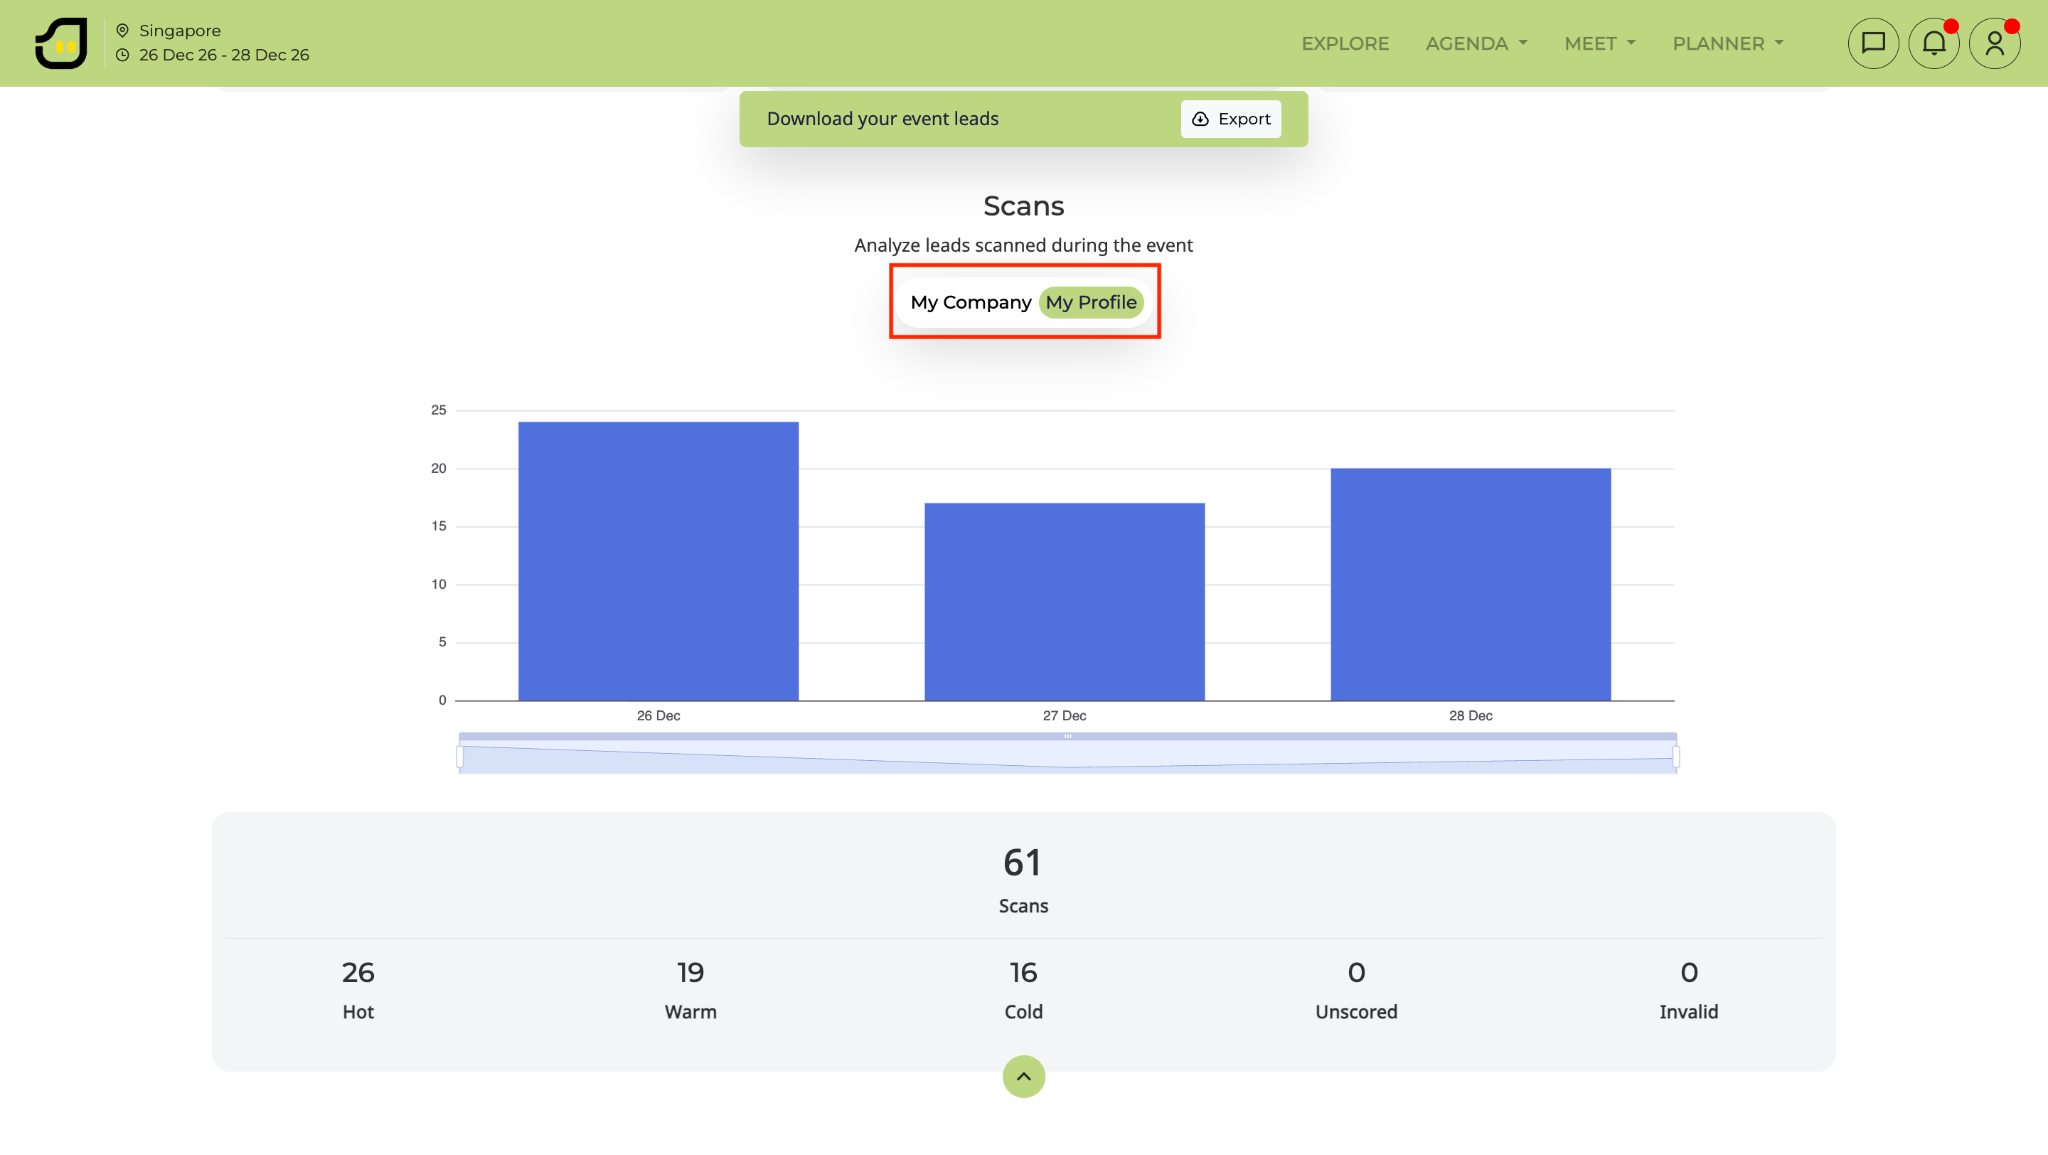
Navigate to the Scans section to view leads captured during the event.
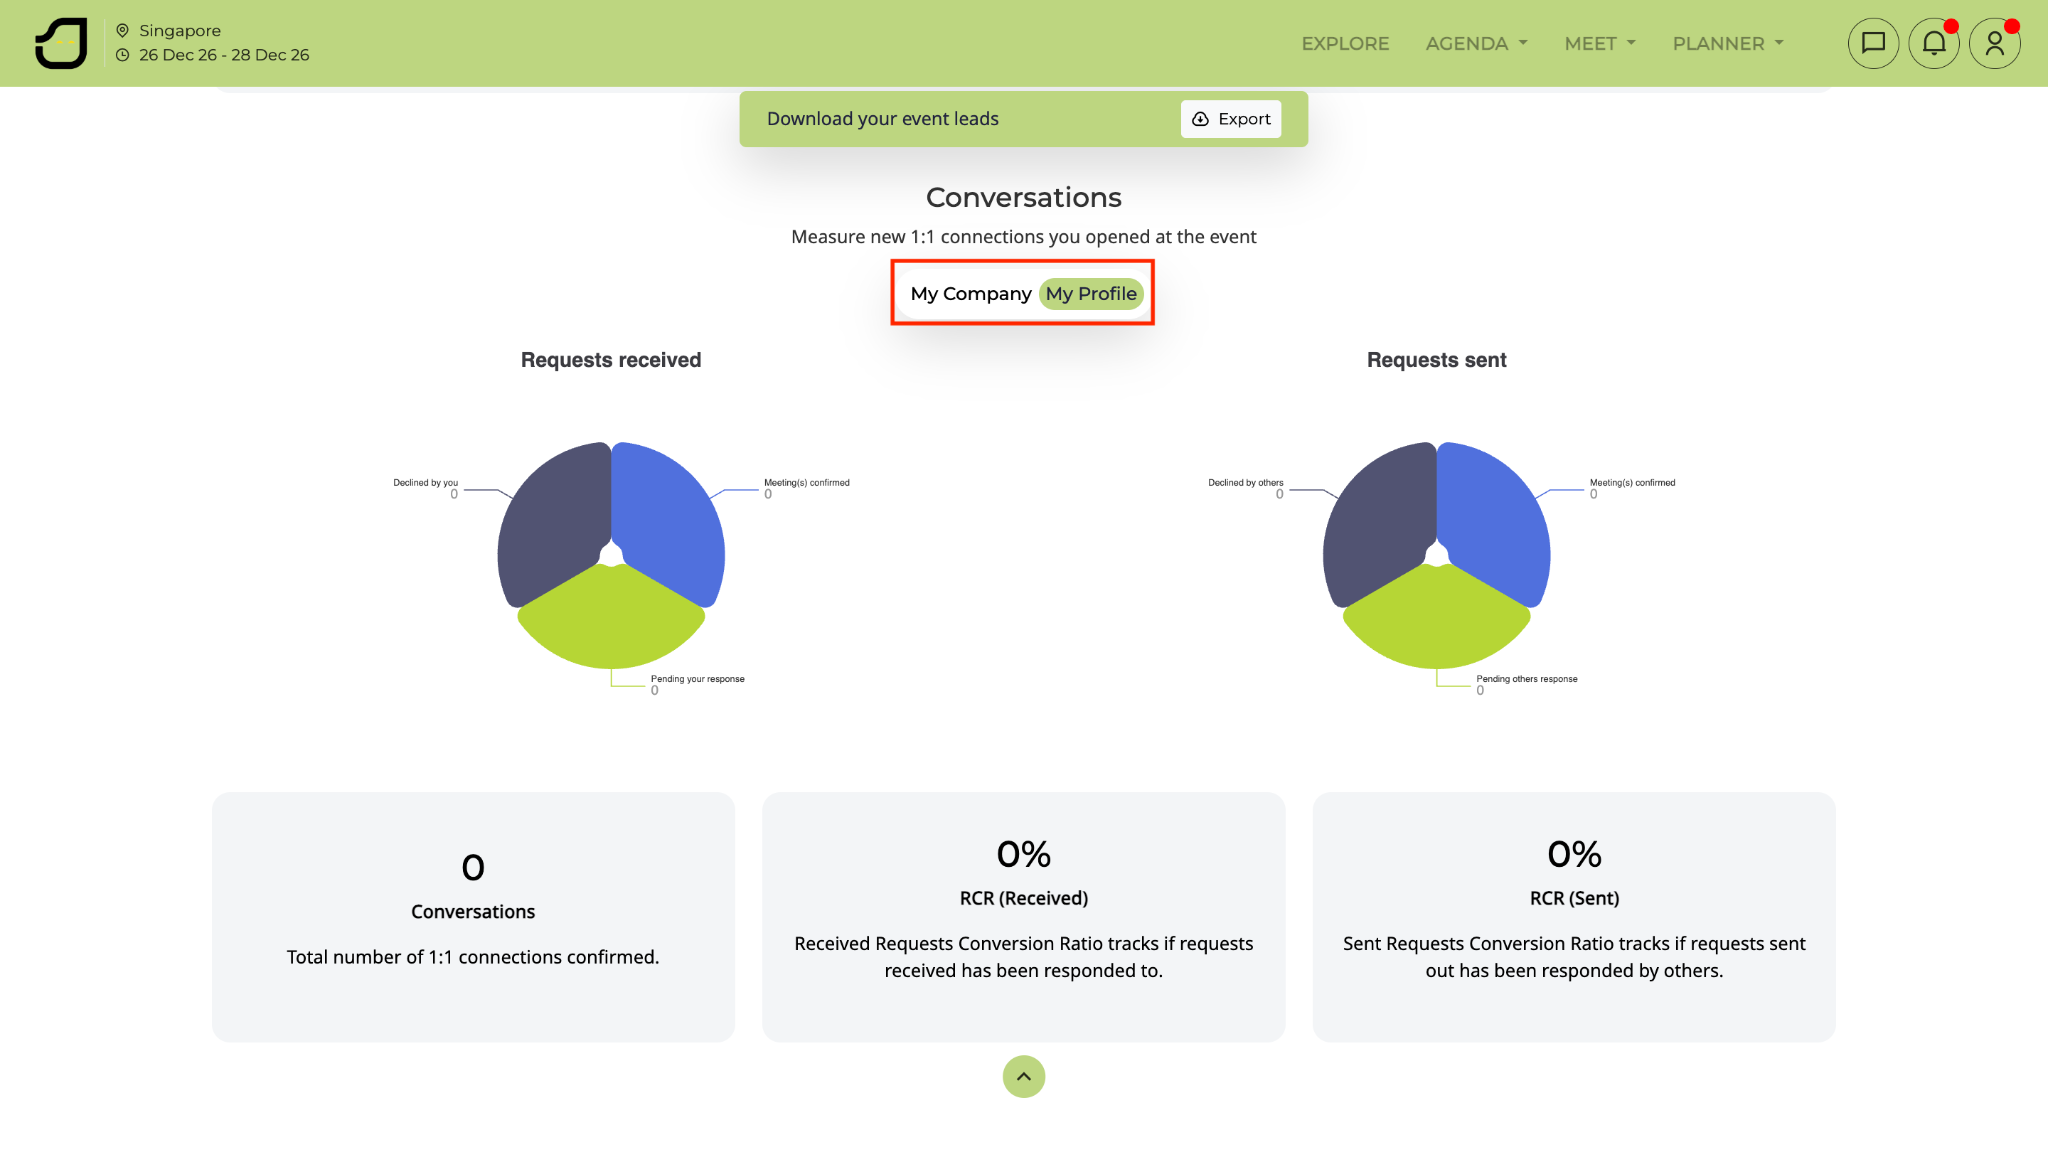
Use the Pie charts to analyze your Received/Sent Requests conversion rates.
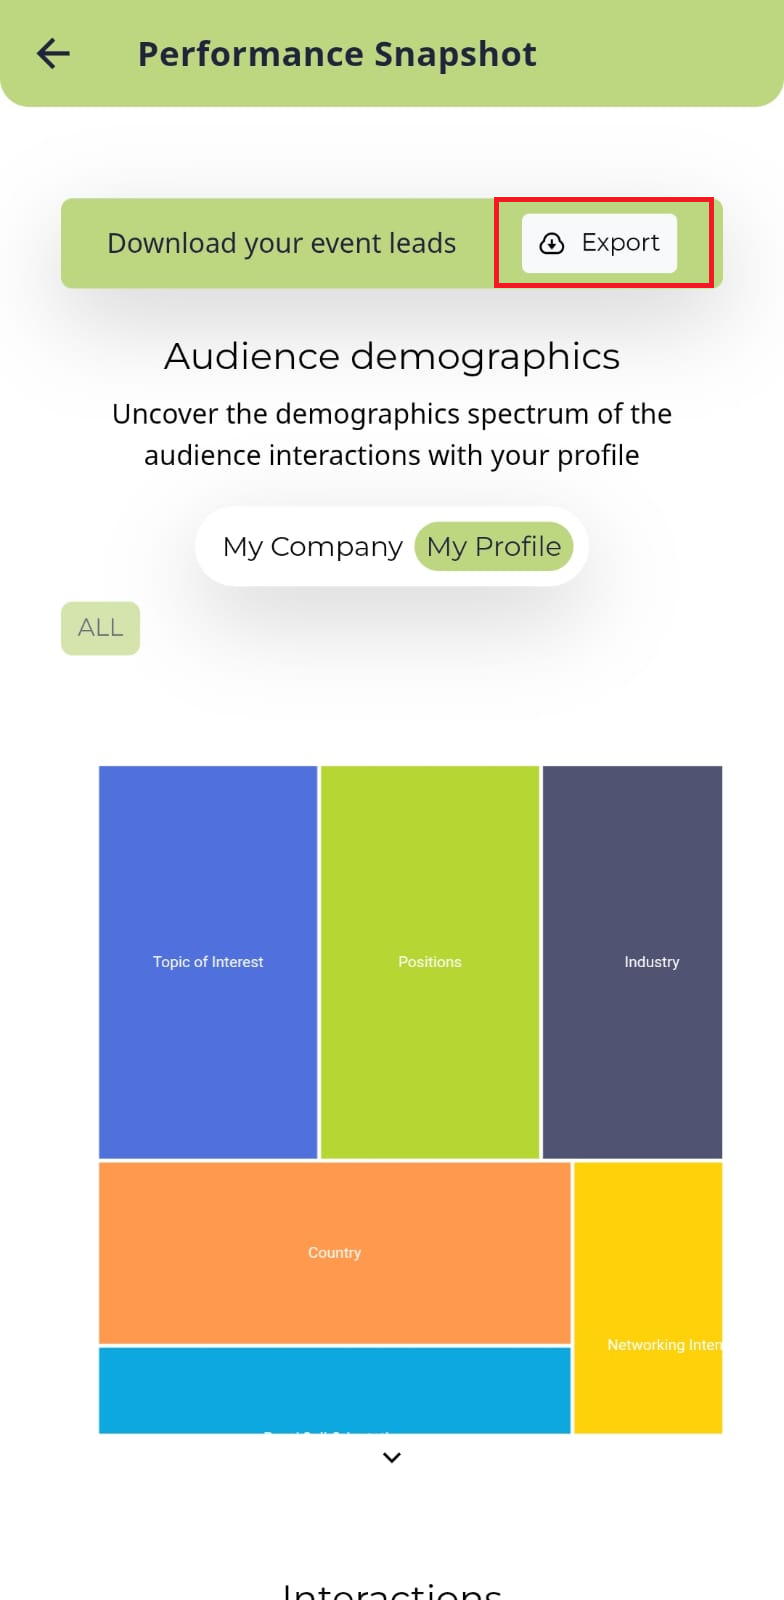
Click the Export button at the top of the page to download a full report of your performance data for future marketing efforts.
Tap the My Profile icon located at the top or bottom of the app screen to access your personal settings.
Tap on the Performance Snapshot menu item to view your mobile-optimized engagement and lead data.
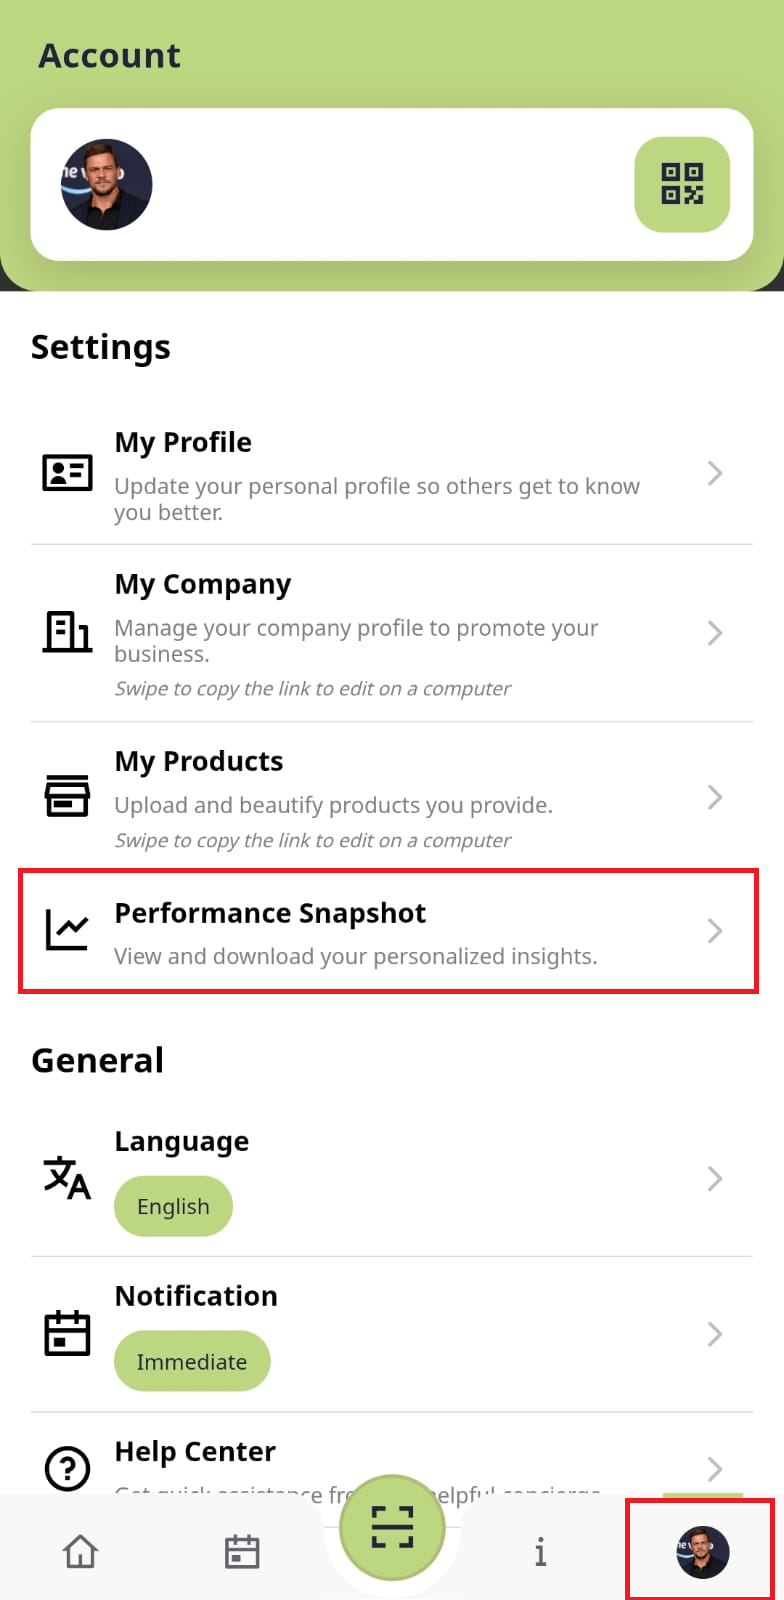
Tap the Export button within the snapshot view to generate and share your analytics report directly from the app. Admin access required, if you are not sure, please reach out to us.